January 15th is Get To Know Your Customers Day so, as per tradition, I’m sharing the results from my reader survey I conducted last month! Thank you to everyone who participated in that, you should have received your New Year’s card in the mail by now.
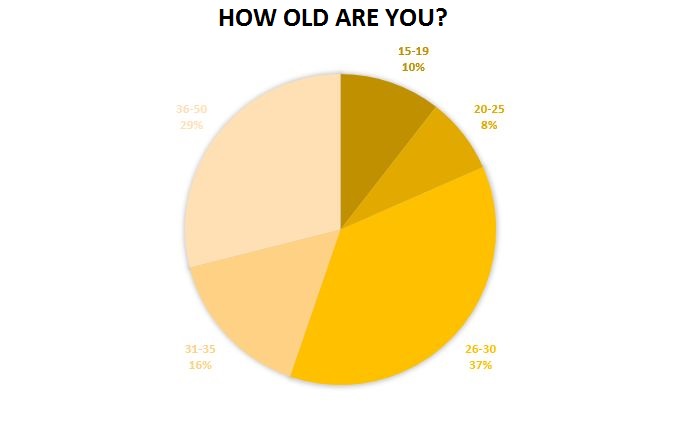
I really wish I had made the 36-50 age range more specific ranges, but I didn’t realize I had that many readers in that demographic! Good to know! The vast majority of you are within 10 years of my age. Go figure…
More about you! Most of you are from somewhere in the United States. The most popular states were Virginia, Illinois, and California. Most of the international countries are in Western Europe, including Norway, Austria, and The Netherlands.
You guys are also super creative!! Almost all of you listed more than one artistic outlet. The most popular were general arts (painting, drawing, illustration) and crafts (mostly needlework, art journaling, and gardening). But there were also a significant amount of writers, photographers, and mail artists.
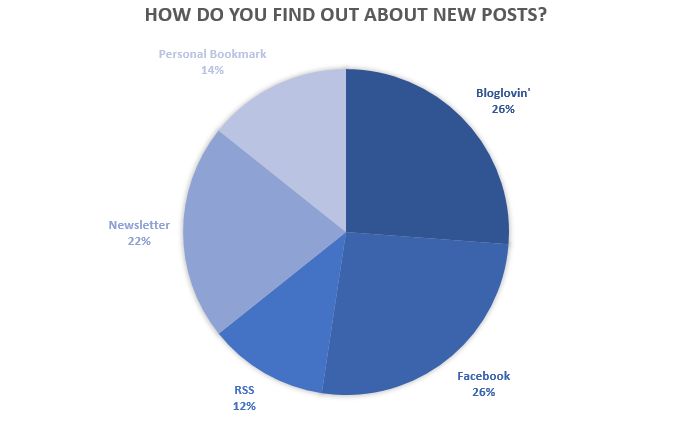
Zero percent of you find out about my posts from Instagram and Twitter. I expected as much from IG, but that means I’m doing a horrible job at Twitter and that’s amazing feedback. I’m also extremely surprised by how many of you find out about new content from my newsletter! (You can subscribe, too!)
In terms of other blogs, your favorites were overwhelmingly similar: Magical Day Dream, Leonie Dawson, Cup Of Jo, A Beautiful Mess, Yes And Yes, The Dainty Squid, Zauberbear, Goodnight Little Spoon, Alexandra Franzen, and Color Me Katie. I’m happy to be among these lovely ladies.
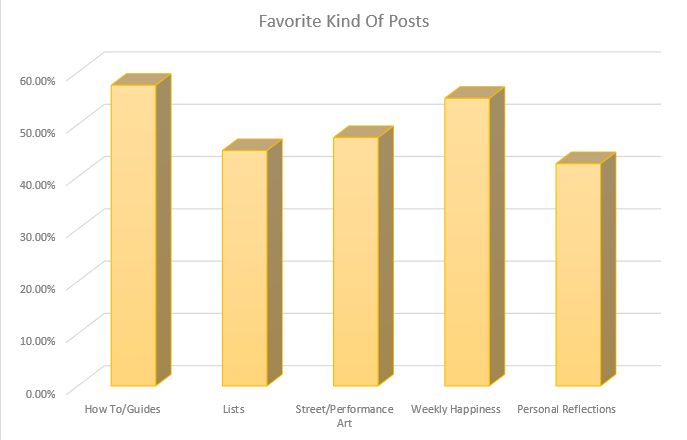
I was surprised that you guys like my weekly happiness posts so much still. Almost three years of hearing me yap about my personal life, and you’re still interested. I’m flattered.
And the last thing I asked was if you had purchased one of my products. There were more yeses than nos, but the highest percentage was from the “No, but I might” category. So what are you waiting for, babe? I’ve got trinkets coming out of my nose for you!
Feel free to check out last year’s results, and thank you again for reading! Follow along with me on Bloglovin’, Twitter, Instagram, Facebook, and Pinterest!